|
|
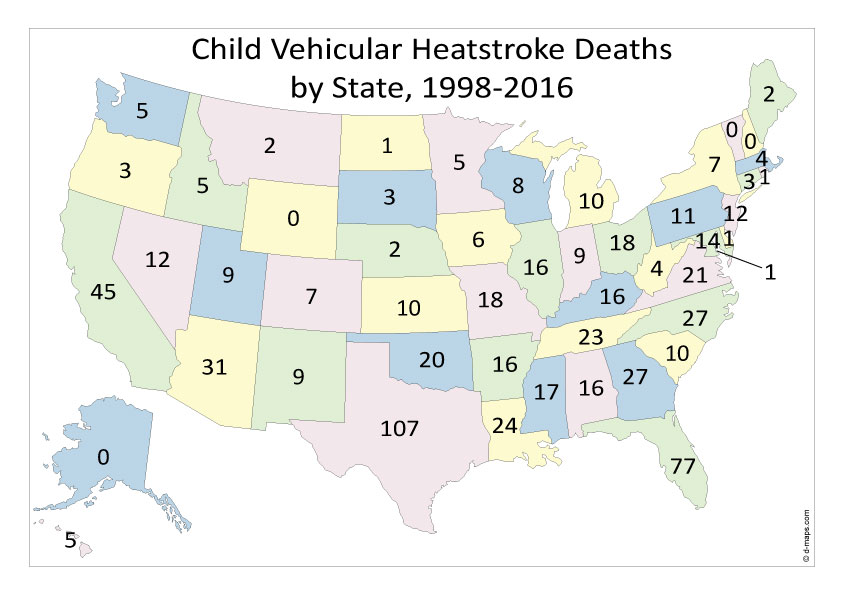
1998-2016 |
Per Capita (1 Million) |
|
State |
Deaths |
< 18 yr |
Worst Rank |
|
Texas |
107 |
20.7 |
9 |
|
Florida |
77 |
24.1 |
6 |
|
California |
45 |
5.6 |
36 |
|
Arizona |
31 |
25.9 |
3 |
|
North Carolina |
27 |
15.5 |
15 |
|
Georgia |
27 |
14.2 |
18 |
|
Louisiana |
24 |
22.9 |
7 |
|
Tennessee |
23 |
18.6 |
11 |
|
Virginia |
21 |
13.5 |
21 |
|
Oklahoma |
20 |
25.1 |
5 |
|
Missouri |
18 |
13.9 |
19 |
| Ohio |
18 |
6.8 |
30 |
|
Mississippi |
17 |
25.9 |
4 |
|
Arkansas |
16 |
26.6 |
1 |
|
Kentucky |
16 |
17.8 |
12 |
|
Alabama |
16 |
16.2 |
13 |
|
Illinois |
16 |
5.5 |
37 |
|
Maryland |
14 |
11.7 |
22 |
|
Nevada |
12 |
26.6 |
2 |
| New
Jersey |
12 |
6.4 |
32 |
|
Pennsylvania |
11 |
4.1 |
41 |
|
Kansas |
10 |
15.2 |
16 |
|
South Carolina |
10 |
11.4 |
23 |
|
Michigan |
10 |
4.3 |
40 |
| New
Mexico |
9 |
20.2 |
10 |
| Utah |
9 |
13.6 |
20 |
|
Indiana |
9 |
6.3 |
34 |
|
Wisconsin |
8 |
6.3 |
33 |
|
Colorado |
7 |
7.0 |
29 |
| New
York |
7 |
1.7 |
47 |
| Iowa |
6 |
8.7 |
27 |
|
Hawaii |
5 |
20.9 |
8 |
|
Idaho |
5 |
14.6 |
17 |
|
Minnesota |
5 |
4.1 |
42 |
|
Washington |
5 |
3.6 |
45 |
| West
Virginia |
4 |
11.0 |
24 |
|
Massachusetts |
4 |
2.9 |
46 |
|
South Dakota |
3 |
16.1 |
14 |
|
Oregon |
3 |
3.9 |
43 |
|
Connecticut |
3 |
3.9 |
44 |
|
Montana |
2 |
9.4 |
26 |
|
Maine |
2 |
7.1 |
28 |
|
Nebraska |
2 |
4.8 |
38 |
|
District of Columbia |
1 |
9.9 |
25 |
|
North Dakota |
1 |
6.6 |
31 |
|
Delaware |
1 |
5.8 |
35 |
|
Rhode Island |
1 |
4.4 |
39 |
|
Alaska |
0 |
0.0 |
48 |
| New
Hampshire |
0 |
0.0 |
49 |
|
Vermont |
0 |
0.0 |
50 |
|
Wyoming |
0 |
0.0 |
51 |
Return to
Hyperthermia Deaths of Children in Vehicles
Questions, comments
or suggestions. Email
jan.null@sjsu.edu
Copyright © 2016,
Golden Gate Weather
Services
Reproduction in full or part is prohibited without permission. |